Unraveling the Heart with STE
Diving deeper into this comparison, imagine if Sherlock Holmes had swapped his magnifying glass for an echocardiogram probe and his deerstalker hat for a lab coat. That’s Speckle Tracking Echocardiography (STE) in a nutshell—a modern-day sleuth in the bustling metropolis of Cardiology.

STE – The Heart’s Detective
With STE, Specialists in Internal Medicine and cardiologists become heart detectives, embarking on an adventure to uncover the hidden tales of each heartbeat.
Think of each speckle as a clue, a tiny breadcrumb left behind by the heart’s muscular movements. These clues are meticulously tracked across the “yoyo”, pulsating landscape of the heart, painting a vivid picture of its health, much like Holmes piecing together evidence to solve a case.
Heart makes a confession
The heart’s every quiver and shake is mapped with such detail, it’s as if the heart is confessing its deepest secrets to a trusted friend. And just as Holmes relied on Watson, STE is supported by Artificial Intelligence (AI) — its loyal companion in decoding the heart’s complex language. Together, they embark on a quest not just to solve a mystery, but to safeguard the essence of life itself. So, in the grand tale of cardiology, STE emerges not merely as a tool, but as a hero, armed with the power of technology and the precision of a detective’s eye.

The How and Why of STE
Imagine you’re an artist, armed not with brushes and paint but with the cutting-edge wizardry of sound waves, embarking on an epic quest to paint not a landscape or a portrait, but the very essence of the heart’s tireless labor. This, mon ami, is the realm of Speckle Tracking Echocardiography (STE), a technique that’s more magical than mundane, transforming the invisible symphony of our heartbeat into a visual spectacle that’s as mesmerizing as it is enlightening.
A ‘sound’ concept
Now, let’s break it down: STE is like having a backstage pass to the heart’s most intimate performances. Picture this: instead of paint, you’re slinging ultrasound waves into the body, where they bounce back like echoes in a vast canyon, carrying secrets of the heart’s inner workings. These echoes map out “speckles” – not the freckles on your nose, but tiny, natural markers within the heart’s muscle that dance to the rhythm of its pulsing beat.

The Celestial Dance
As the heart goes through its motions – contracting and relaxing like the chest of a sleeping giant – these speckles move along, creating a live, pixelated show of the heart’s choreography. It’s like tracking stars across the night sky, except these stars illuminate the pathways of cardiac motion.

Med marries Tech
Enter the wizardry of artificial intelligence, the Gandalf of this tale, which takes these epic sagas of speckle movement and deciphers them into tales of the heart’s health, vitality, and efficiency. It’s a fusion of technology and medicine that’s as close as we’ve come to peering directly into the heart’s soul, unveiling the subtleties and nuances of its performance that were once cloaked in mystery.

The beating beauty
Through the lens of STE, we’re offered a window into the heart’s operation, a dynamic image that’s as revealing as it is revolutionary. It’s a blend of art and science, where sound waves become the brushstrokes that reveal the heart’s hidden tales, and AI the interpreter that translates these tales into insights we can understand and act upon. So, in a world where STE is the artist and the heart is the canvas, we’re just beginning to appreciate the masterpiece that’s been beating within us all along.

The Heart’s Chambers Unveiled
Imagine your heart’s left ventricle as the main engine room of a mighty ship, where the engine’s job is to pump water out to keep the ship moving smoothly through the vast ocean. In the case of your body, this engine room isn’t pumping water, but blood, and the ocean it’s navigating is your vast network of arteries and veins.
The left ventricle is crucial because it’s the chamber of the heart that does the heavy lifting, pumping oxygen-rich blood from your lungs out to the rest of your body, ensuring every part gets the oxygen it needs to function. It’s like the most diligent delivery service, making sure every cell gets its vital package on time, every time.

The Water balloon
Now, let’s talk about systolic and diastolic function, using everyday analogies to make it crystal clear. Imagine your left ventricle as a high-powered water balloon. During systole, the ventricle contracts like a fist squeezing the balloon, propelling the blood out and into the arteries. This is the phase where the heart is working hard, pushing blood out like a firefighter’s hose blasting water to extinguish a fire. The force with which it pumps defines the heart’s systolic function, essentially its ability to contract and push blood out.
Diastolic function, on the other hand, is all about relaxation. After the ventricle squeezes and sends blood on its way, it needs to relax and fill back up with blood, just like how the water balloon refills for the next round. This phase is like the calm after the storm, where the heart opens up, allowing blood to pour in from the lungs, readying itself for the next big squeeze. Diastolic function measures the heart’s ability to relax and fill, kind of like how efficiently a sponge soaks up water to be used again.

Tbe tireless pump
In essence, the left ventricle’s job, through its systolic and diastolic functions, is akin to the most efficient, life-sustaining pump you can imagine. It’s a cycle of squeezing and relaxing, pumping and filling, that keeps the river of life flowing through your body, ensuring that every nook and cranny is nourished and energized to keep you going. Without this tireless work, the body wouldn’t receive the oxygen and nutrients it needs, highlighting just how pivotal the left ventricle really is.
A Heart Divided
Imagine the left ventricle (LV) of the heart as a gourmet chocolate bar that’s been meticulously crafted into 17 segments, each with its own unique taste and contribution to the overall delight of the chocolate experience.

Just as breaking a chocolate bar into segments makes it easier to share and enjoy piece by piece, the division of the LV into 17 segments helps doctors and medical professionals analyze and understand the heart’s function in a detailed and systematic way. And this is how the big guys – American College of Cardiology (ACC) and American Heart Association (AHA) as well as the European Society of Cardiology (ESC) – have cut the cake!
Here’s how the analogy breaks down:
- Basal Segments (1-6): Think of the basal segments as the top row of the chocolate bar, closest to the wrapper’s edge. These six pieces represent the upper part of the LV, near the heart’s base. They’re crucial for initiating the heart’s pumping action, much like how the first bites of chocolate set the tone for your tasting experience.
- Mid-Cavity Segments (7-12): Moving down to the middle of the chocolate bar, these six segments correspond to the mid-portion of the LV. They’re like the heart of the chocolate bar, offering a consistent and satisfying flavor. In the heart, these segments play a key role in the main pumping action, showcasing the strength and endurance of the LV’s muscular walls.
- Apical Segments (13-16): The next four pieces towards the bottom of the chocolate bar represent the apical segments of the LV, pointing towards the heart’s tip. These are like the last few bites of chocolate that leave a lasting impression, critical for the efficient ejection of blood out of the heart.
- Apex (Segment 17): Finally, the very last piece of the chocolate bar, perhaps shaped a bit differently from the rest, symbolizes the apex of the LV. This single segment is like the finale of your chocolate experience, the culmination of the heart’s pumping process, where the contraction is strongest to push blood through the body.
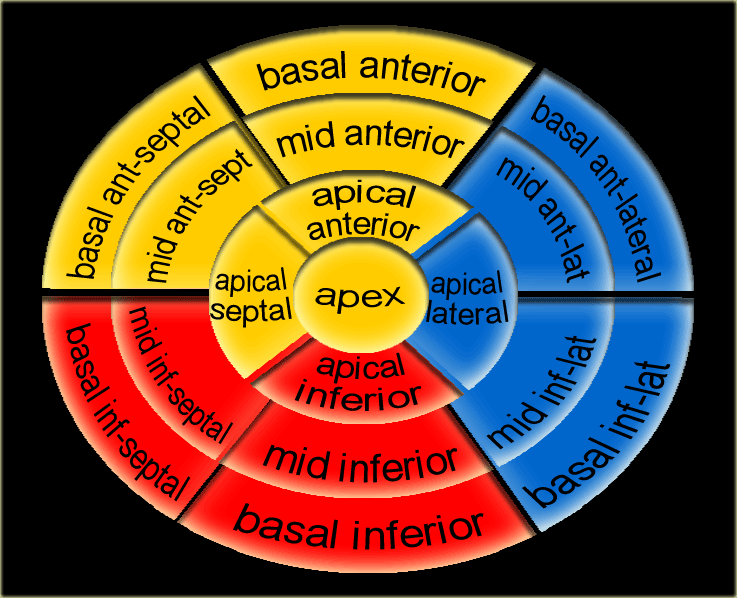
A sneak peek into the pump
Just as each segment of the chocolate bar contributes to the overall flavor and enjoyment, each segment of the LV has a specific role in the heart’s function. Doctors use this segmentation to precisely diagnose and treat heart conditions, identifying which parts of the LV are working well and which may be underperforming. It’s a method that adds both precision and clarity to the complex task of heart care, ensuring each “piece” of the heart is given the attention it deserves.

The Magic of Global Longitudinal Strain (GLS)
Global Longitudinal Strain (GLS) is a sophisticated measure used by cardiologists to assess the heart’s function, specifically focusing on the left ventricle’s ability to contract and pump blood. Think of GLS as the heart’s report card, giving doctors a detailed insight into how well the heart is performing its main job.
Now, the magic number here is “-17”. When you see GLS being talked about, a “-17” (or higher, meaning more negative) is akin to getting an A on that report card. It signifies that the heart muscle is strong, healthy, and contracting with gusto. If the GLS is less negative than -17, it’s like the heart’s performance is slipping—imagine getting a C or a D, indicating that the heart might be facing some challenges in pumping blood efficiently.
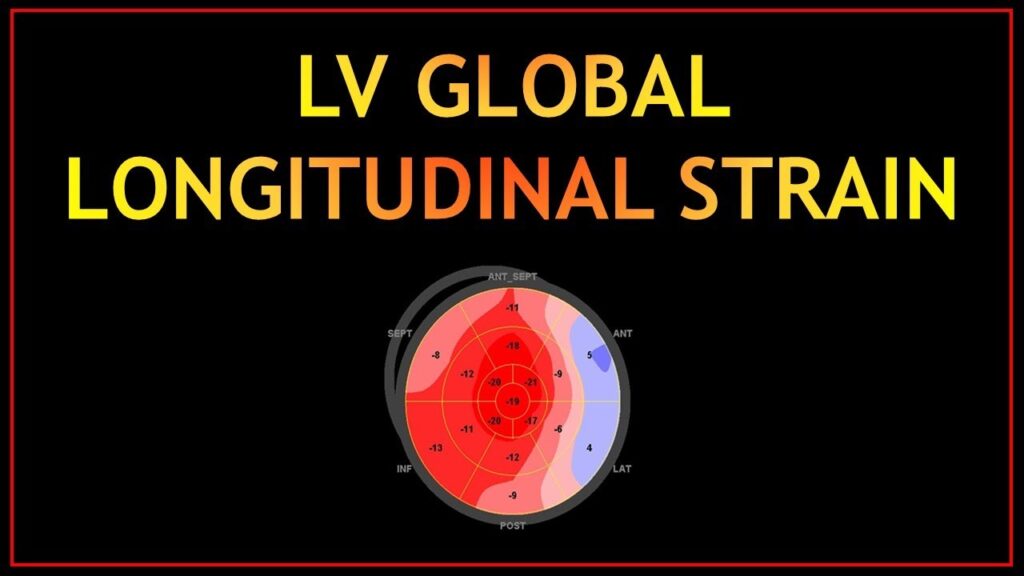
Color coding
Diving into the color coding based on the Nyquist limit, let’s bring in the mood ring analogy. A mood ring changes colors based on temperature, supposedly reflecting your emotional state. In the world of echocardiography, color coding does something similar for the heart, but instead of emotions, it reflects the speed and direction of blood flow. The Nyquist limit is a critical threshold in Doppler imaging that helps to differentiate between normal and abnormal blood flow speeds.
In this colorful display, briskly moving speckles might show up as shades of red, while lazy ones might appear blue. This color shift helps doctors spot areas of the heart where muscle movement isn’t as smooth as it should be, pointing to potential issues like wall motion abnormalities or heart muscle abnormalities.
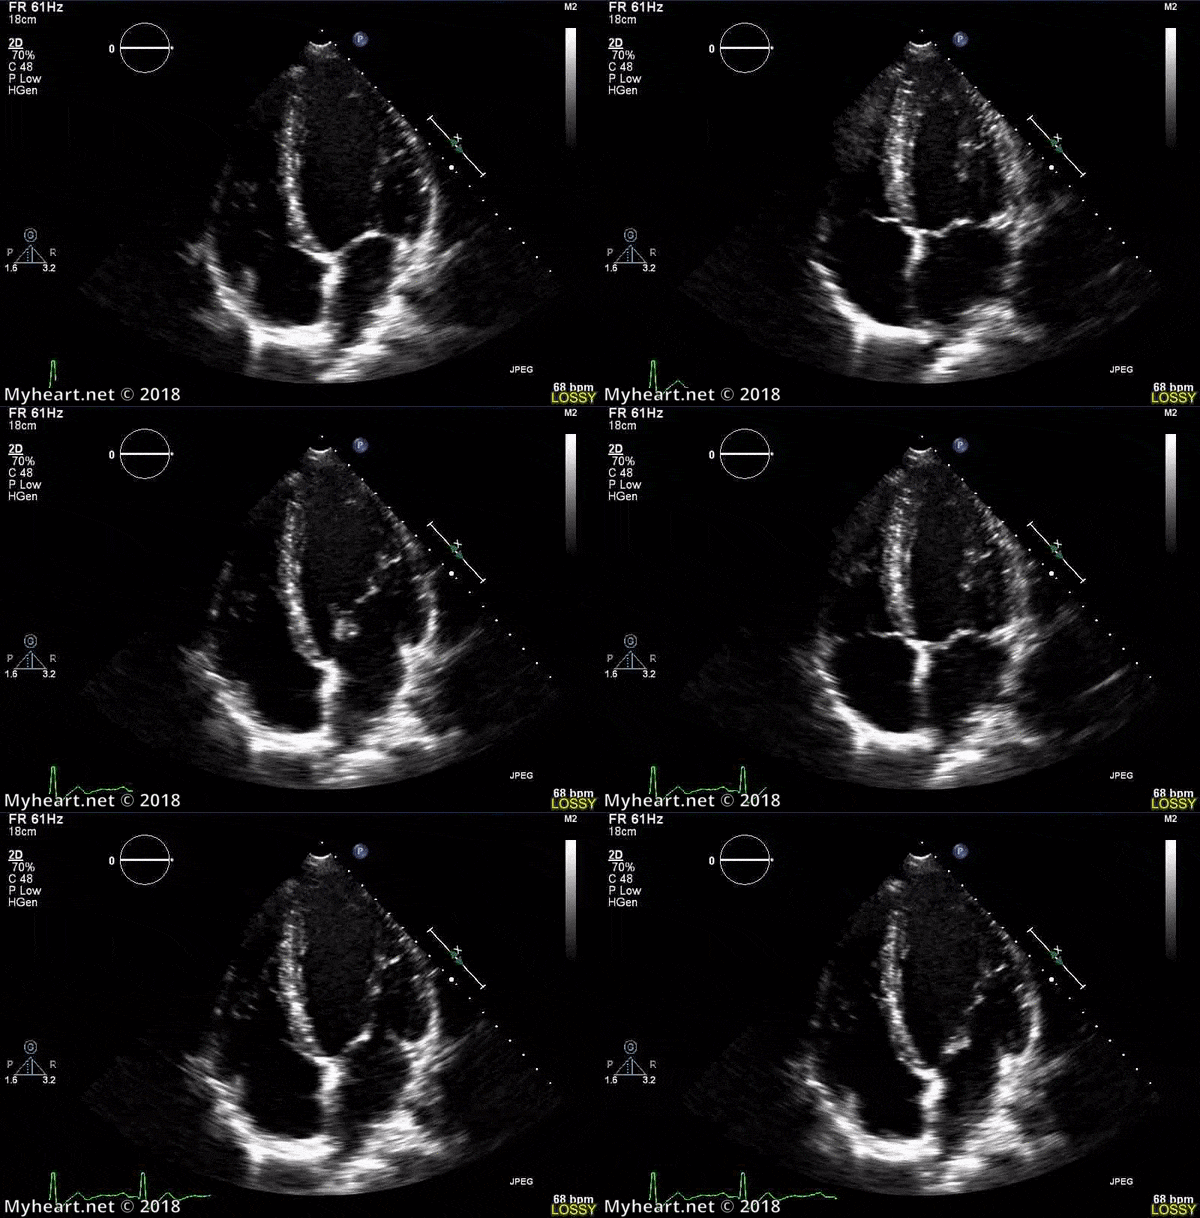
The magnificent mood ring
So, through the lens of GLS and the technicolor insights provided by the Nyquist limit, cardiologists have a powerful toolkit at their disposal, akin to having a mood ring that reveals the heart’s health and vigor. This sophisticated approach allows for early detection and precise treatment of heart conditions, ensuring that the heart keeps pumping strongly and healthily, just like maintaining an A+ on the heart’s report card.
The Bullseye Plot
Imagine you’re an artist tasked with painting a masterpiece that captures the complex essence of heart function, using a palette that blends science with visual art. Your canvas? The bullseye plot, a revolutionary way to depict the heart’s performance, particularly through the lens of the left ventricle’s (LV) function and its 17 segments.
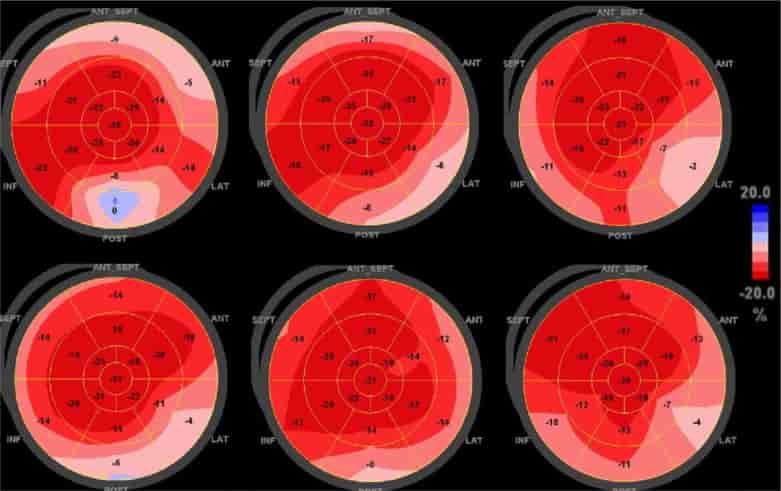
Creating a bullseye plot is akin to drawing a dartboard, where each segment of the board represents a different part of the LV. But instead of aiming darts, you’re mapping the health and function of each cardiac segment. The center of the bullseye corresponds to the apex of the heart, the tip of the LV, while the outer rings represent the basal (upper) segments, moving through the mid-cavity segments as you approach the center. Each segment’s performance, captured through measurements like strain from speckle tracking echocardiography, is painted with a unique color, indicating how well that part of the heart is functioning.
Heart’s whether map
The beauty and visual appeal of the bullseye plot lie in its simplicity and immediacy. It’s like looking at a weather map for the heart. Just as meteorologists use different colors to show temperatures or precipitation across regions, the bullseye plot uses colors to represent the health of heart segments. Healthy, well-functioning segments might be painted in vibrant, warm colors, signaling strong performance. In contrast, areas of concern might be shaded in cooler tones, indicating reduced function or potential damage.
Decoding the Bullseye
The bullseye plot, with its visually intuitive design, revolutionizes the way we teach and understand the complexities of heart function. Imagine it as a Rosetta Stone for cardiologists and medical students alike, translating the intricate language of cardiac health into a visual dialect that’s immediately comprehensible. This tool simplifies the vast and complex data collected from advanced cardiac imaging into a single, coherent image, much like how a complex puzzle is solved piece by piece until the full picture emerges clearly.

Specific patterns on the bullseye plot can indeed be likened to deciphering a secret code, where each color and its placement reveal crucial information about the heart’s condition. For instance:
- Uniform Patterns: A bullseye plot that shows consistent colors across all segments suggests a heart with uniform function, akin to a well-oiled machine where all parts are working in harmony. This is the pattern you’d hope to see, indicating a strong and healthy heart.
- Regional Variations: If certain areas of the bullseye plot display different colors compared to the rest, it’s like finding a cluster of clues in a treasure hunt. This pattern can indicate localized heart issues, such as regional wall motion abnormalities, where specific parts of the heart muscle are not contracting as well as they should. These areas might be under stress or damage, possibly due to conditions like ischemic heart disease.
- Gradient Patterns: A gradual change in color from the outer rings to the center might suggest a gradient in the heart’s performance, from the basal to the apical segments. This could unveil conditions like apical hypertrophy or reveal how the heart’s performance diminishes from its base to its apex.
- Isolated Abnormalities: Just as a single out-of-place piece can draw attention in a puzzle, an isolated segment with a drastically different color can signify a specific area of concern. This might point to localized issues such as myocardial infarction (heart attack) in a particular region, where the affected segment fails to contract efficiently.
By translating complex cardiac functions into these decipherable patterns, the bullseye plot serves as a powerful educational tool, enhancing the learning experience for medical students and facilitating patient understanding. It demystifies the heart’s operation, allowing for a clearer conversation about diagnoses, treatments, and outcomes. Educators can use these visual patterns to teach about various cardiac conditions in a more engaging and accessible manner, fostering a deeper understanding by showing exactly where and how the heart’s function is affected.

In essence, the bullseye plot empowers both clinicians and learners to visualize heart health in a new light, turning the abstract into the tangible. It’s a testament to how modern medicine can blend complexity with clarity, inviting us all to unlock the secrets of the heart through a shared visual language.
on how the bullseye plot simplifies teaching and understanding heart function. Mention specific patterns that indicate certain conditions, akin to deciphering a secret code.
STE in Action
So guys, Speckle Tracking Echocardiography (STE) has emerged as a game-changer in the cardiology field, providing a nuanced, in-depth look at the heart’s mechanical function that traditional imaging techniques struggle to capture. Think of STE as a high-definition, slow-motion camera that can capture the detailed mechanics of a hummingbird in flight. Similarly, STE allows cardiologists to observe the heart’s movements at such a granular level, unveiling subtleties in myocardial function that are invisible to the naked eye or conventional imaging.
Monitoring Severity of Coronary Artery Disease (CAD)
In the context of Coronary Artery Disease (CAD), STE is like a detective with a magnifying glass, scrutinizing the heart’s muscle movements for any signs of distress or dysfunction. CAD occurs when the coronary arteries become narrowed or blocked, reducing blood flow to the heart muscle and potentially weakening it. By analyzing the motion of speckles (natural acoustic markers) within the heart’s muscle tissue, STE can detect early signs of myocardial ischemia (a condition where the heart muscle doesn’t get enough oxygen) before symptoms or other test results become apparent.
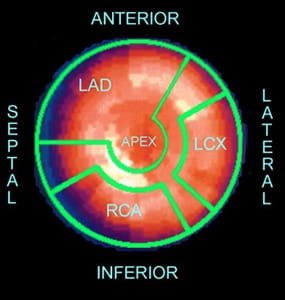
For instance, STE can identify subtle changes in the heart’s deformation or strain patterns, especially in regions supplied by diseased arteries. A decrease in the global longitudinal strain (GLS) value, for example, can indicate that the heart muscle isn’t contracting as vigorously as it should, suggesting impaired function due to inadequate blood supply. This allows clinicians to gauge the severity of CAD and tailor their management strategies accordingly, potentially before more significant damage occurs.
Tracking Heart Failure Progression and Treatment Efficacy
Heart failure, a condition where the heart cannot pump adequately to meet the body’s needs, presents a complex challenge in cardiology. STE steps in as a sophisticated tool to track the progression of heart failure by offering detailed insights into the heart’s pumping efficiency and ventricular mechanics. It goes beyond ejection fraction (a common measure of heart function) to provide a multidimensional view of cardiac performance.

In evaluating the effectiveness of drug therapies, STE acts as a precise measuring tape, quantifying even slight improvements or deteriorations in heart function that result from medication adjustments. For example, drugs aimed at improving heart function or relieving the workload on the heart (such as ACE inhibitors, beta-blockers, or ARBs) can be monitored for their effectiveness over time. Improvements in strain values or more uniform strain patterns across the myocardium can indicate successful therapeutic intervention, guiding clinicians in optimizing treatment plans for individual patients.
Moreover, STE’s ability to detect early signs of ventricular dysfunction allows for preemptive adjustments in therapy, potentially averting hospitalizations or more severe heart failure stages. It enables a personalized approach to medicine, where treatments are continuously fine-tuned in response to the patient’s current heart function, as precisely captured by STE.
The Closing jest (Just to keep you smiling!)
In the landscape of cardiovascular care, STE stands out as a powerful ally in the fight against heart disease. By providing a window into the heart’s deepest workings, it enables a level of precision and personalization in diagnosis and treatment that was previously unattainable.

Whether it’s tracking the shadowy progression of CAD or navigating the complex waters of heart failure management, STE equips clinicians with the insights needed to make informed, impactful decisions. It’s not just about capturing images; it’s about revealing stories—each heartbeat at a time—allowing for a deeper understanding and more effective treatment of heart conditions.